

The moment you open a second location, your numbers stop telling the truth. Not because the data is wrong, but because you're reading it at the wrong altitude. A single studio owner looks at monthly revenue and roughly knows what's happening. The owner of four studios looks at that same blended number and sees nothing useful — one location could be subsidizing three that are quietly bleeding, and the top-line average hides all of it.
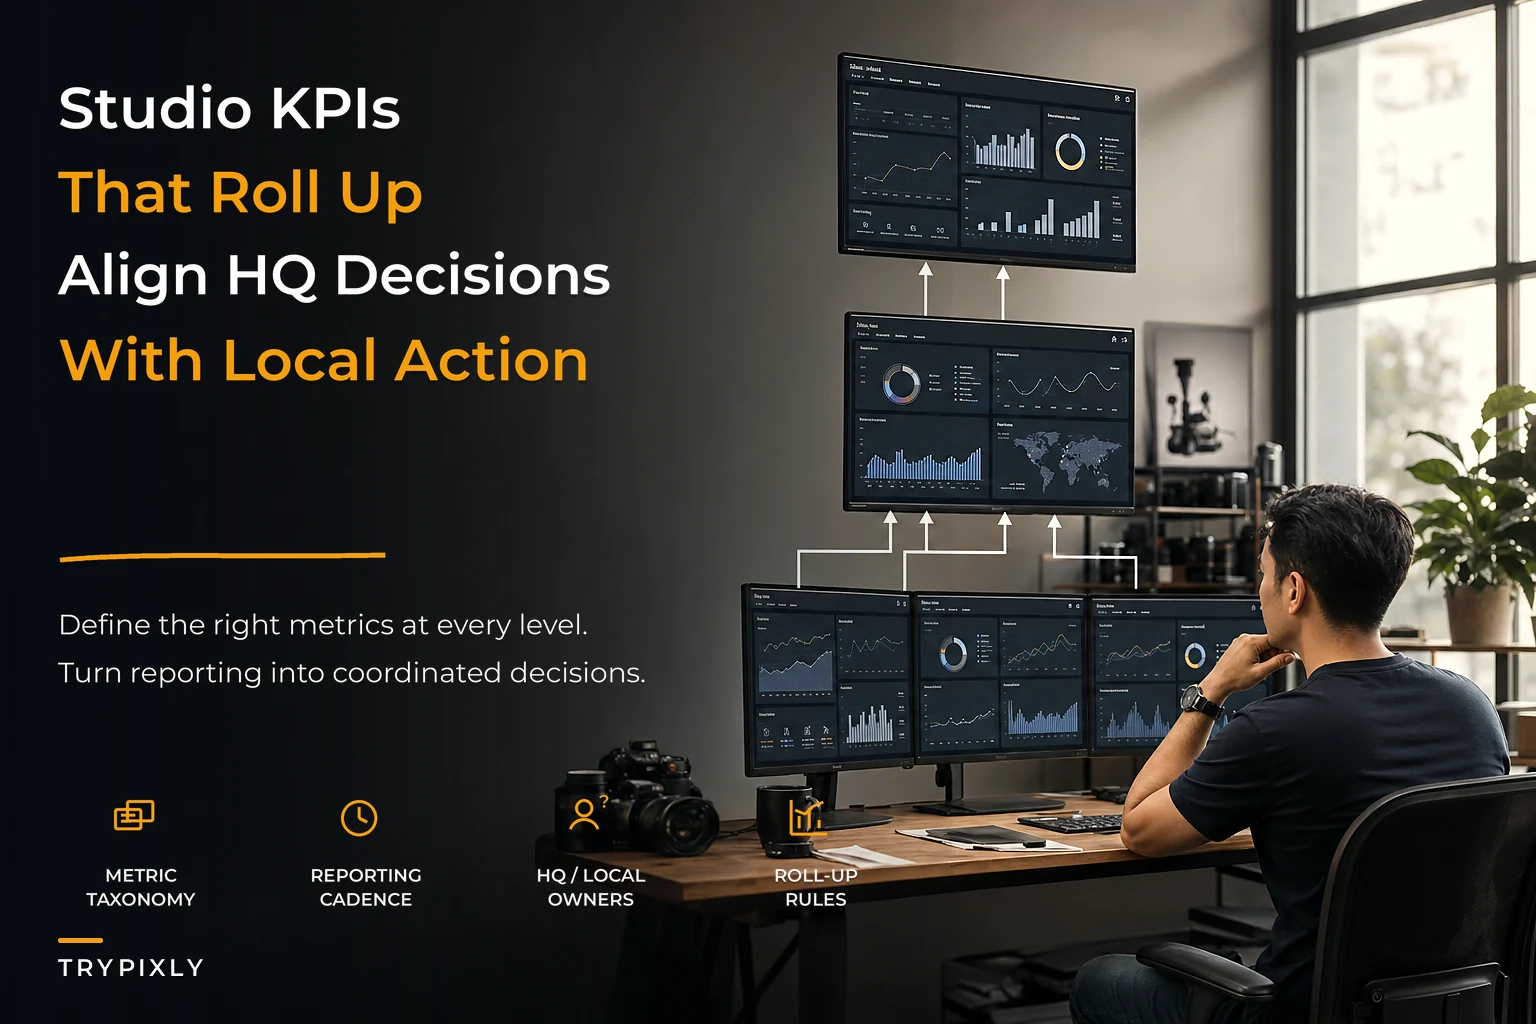
This is the real problem with scaling a photography business: your reporting doesn't scale at the same speed your operations do. You add locations, photographers, session types, and suddenly you're drowning in dashboards that nobody trusts and spreadsheets that three different people maintain slightly differently. The fix isn't more metrics. It's a taxonomy — a disciplined way of defining, grouping, and rolling up your numbers so that HQ sees the forest and each location manager sees their own trees.
Why multi-location studio KPIs break down (and it's rarely the math)
The breakdown almost never happens because someone can't add. It happens because definitions drift.
A pattern that shows up constantly once a studio hits three or more locations: each site defines a "booked session" differently. Location A counts it when the deposit clears. Location B counts it when the consult is scheduled. Location C counts it when the calendar hold is created, deposit or not. Now HQ asks "how many sessions did we book last month?" and gets three answers that aren't comparable. The number exists. It just doesn't mean anything.
The second failure is granularity confusion — people trying to run a location with HQ-level metrics and run HQ with location-level detail. A studio manager doesn't need the consolidated gross margin across the whole company. She needs to know her no-show rate this week and whether her editors are falling behind. The founder doesn't need to see every individual gallery delivery time; he needs to know which location's turnaround is trending in a direction that will cost him repeat business next quarter.
When those altitudes get mixed, two things happen:
-
HQ micromanages the wrong things because they're staring at operational noise
-
Location managers feel accountable for numbers they can't actually influence
A clean KPI taxonomy solves both by assigning each metric a level and a roll-up rule before anyone argues about performance.
The three altitudes of studio metrics
Think of your metrics as living on three floors of the same building.
Never miss a shoot or client detail again.
TryPixly helps you book, confirm, and manage every photography session seamlessly.
- Unified session and client management
- Automated client reminders
- Team calendar & resource scheduling
No credit card required
Operational metrics live on the ground floor. These are the daily and weekly signals a location manager uses to run the floor: no-show rate, same-week booking fill, editor queue depth, gallery turnaround time, reshoot rate. They're fast-moving and they belong to the person on-site.
Tactical metrics live on the middle floor. Monthly signals a regional manager or ops lead uses to spot drift and reallocate: package mix per location, average order value, capacity utilization, lead-to-book conversion, labor cost as a percentage of session revenue. This is where patterns become visible before they become problems.
Strategic metrics live on the top floor. Quarterly signals the owner uses to decide where to invest: contribution margin per location, revenue per available slot, customer acquisition cost by channel, lifetime value by session type, and the big one — profit per location after fully loaded costs. The work of tying cost-per-slot, package mix, and post-production into real decision rules is something covered in depth in the studio profitability system, and those outputs become your top-floor numbers.
The rule that keeps this clean: a metric lives on exactly one floor as a decision tool, even if it's visible on others. No-show rate is a decision tool for the location manager. HQ can see it, but HQ doesn't act on a single week's no-show spike — HQ acts on a quarter-long trend across locations.
Roll-up rules: where most studios quietly go wrong
Rolling up metrics sounds trivial — add the locations together. It's not, and the errors here are expensive because they're invisible.
Some metrics sum. Total sessions, total revenue, total deposits collected. Easy.
Some metrics weight. This is where studios mangle their numbers. You cannot average four locations' average order values and call it the company AOV. A location doing 15 sessions at $900 and a location doing 120 sessions at $450 don't contribute equally. You have to weight by volume. The naive average says company AOV is $675. The real, volume-weighted number is closer to $500. That $175 gap is the difference between thinking you're a premium studio and actually being a volume studio.
Some metrics don't roll up at all and should never be summed. Utilization rate is the classic trap. You can't add location utilizations — you have to recompute from raw inputs: total booked slot-hours divided by total available slot-hours across the group. If you average the percentages, a tiny high-utilization location will mask a big underperformer.
A compact reference for how common studio metrics should actually roll up:
| Metric | Level | Roll-up method | Common mistake |
|---|---|---|---|
| Total sessions | Operational → Strategic | Sum | None — this one's safe |
| Revenue | All | Sum | Mixing deposit vs. recognized revenue |
| Average order value | Tactical | Volume-weighted mean | Simple averaging across locations |
| Capacity utilization | Tactical | Recompute from raw slot-hours | Averaging the percentages |
| No-show rate | Operational | Weighted by sessions, not averaged | Treating all locations as equal |
| Gallery turnaround | Operational | Median per location, then compare | Using mean (one disaster skews it) |
| Contribution margin | Strategic | Sum of dollars, then recompute % | Averaging margin percentages |
| Lead-to-book conversion | Tactical | Weighted by lead volume | Averaging conversion rates |
The pattern worth memorizing: percentages almost never roll up by averaging. When you see a percentage, ask what the numerator and denominator actually are, then roll up those raw numbers and recompute. This one habit prevents most of the bad decisions that come out of multi-location dashboards.
Building the dashboard wireframes
A dashboard is not a report. A report is backward-looking and comprehensive. A dashboard is a decision tool and should be ruthlessly incomplete. If a number on the dashboard doesn't change what someone does this week, it's clutter.
Location dashboard (ground floor)
What a location manager should see the moment they log in, top to bottom:
-
This week's fill rate vs. target — the single most actionable number for staffing and promo decisions
-
No-show and cancellation count this week, with a 4-week sparkline so a bad week reads differently from a bad trend
-
Editor queue depth — how many galleries are waiting, and the oldest one's age in days
-
Gallery turnaround median for sessions delivered this week
-
Upsell / AOV for the week, so the sales conversation stays alive
Five blocks. That's it. The temptation to add contribution margin here is strong and wrong — the location manager can't act on it weekly and it just teaches people to ignore the screen.
Regional dashboard (middle floor)
A regional ops lead running three to six locations needs comparison, not detail. The wireframe is a grid: locations down the side, tactical metrics across the top, with conditional color on variance from target.
-
Capacity utilization per location (recomputed, not averaged)
-
Package mix — what percentage of sessions landed in each tier
-
Lead-to-book conversion by location
-
Labor cost as a percent of session revenue
-
Reshoot and revision rate as a quality early-warning
The job of this view is to answer one question fast: which location is drifting, and in which direction? When one location's package mix suddenly skews cheap while the others hold, that's a sales-process problem at that site, not a market problem.
HQ dashboard (top floor)
The owner's view should fit on one screen and be almost boring. Contribution margin per location. Revenue per available slot. Trailing trend lines, not weekly noise. A ranked list of locations by profit after fully loaded costs. And — critically — seasonality-adjusted comparisons, because comparing a beach-town studio in July to a corporate-headshot studio in July without accounting for the season is how owners make genuinely bad capacity decisions. The seasonal planning problem is broken down in detail in the piece on cross-functional planning to smooth cashflow, and those adjustments belong baked into the HQ view.
Here's a simple visual of how the three dashboard levels feed decisions.
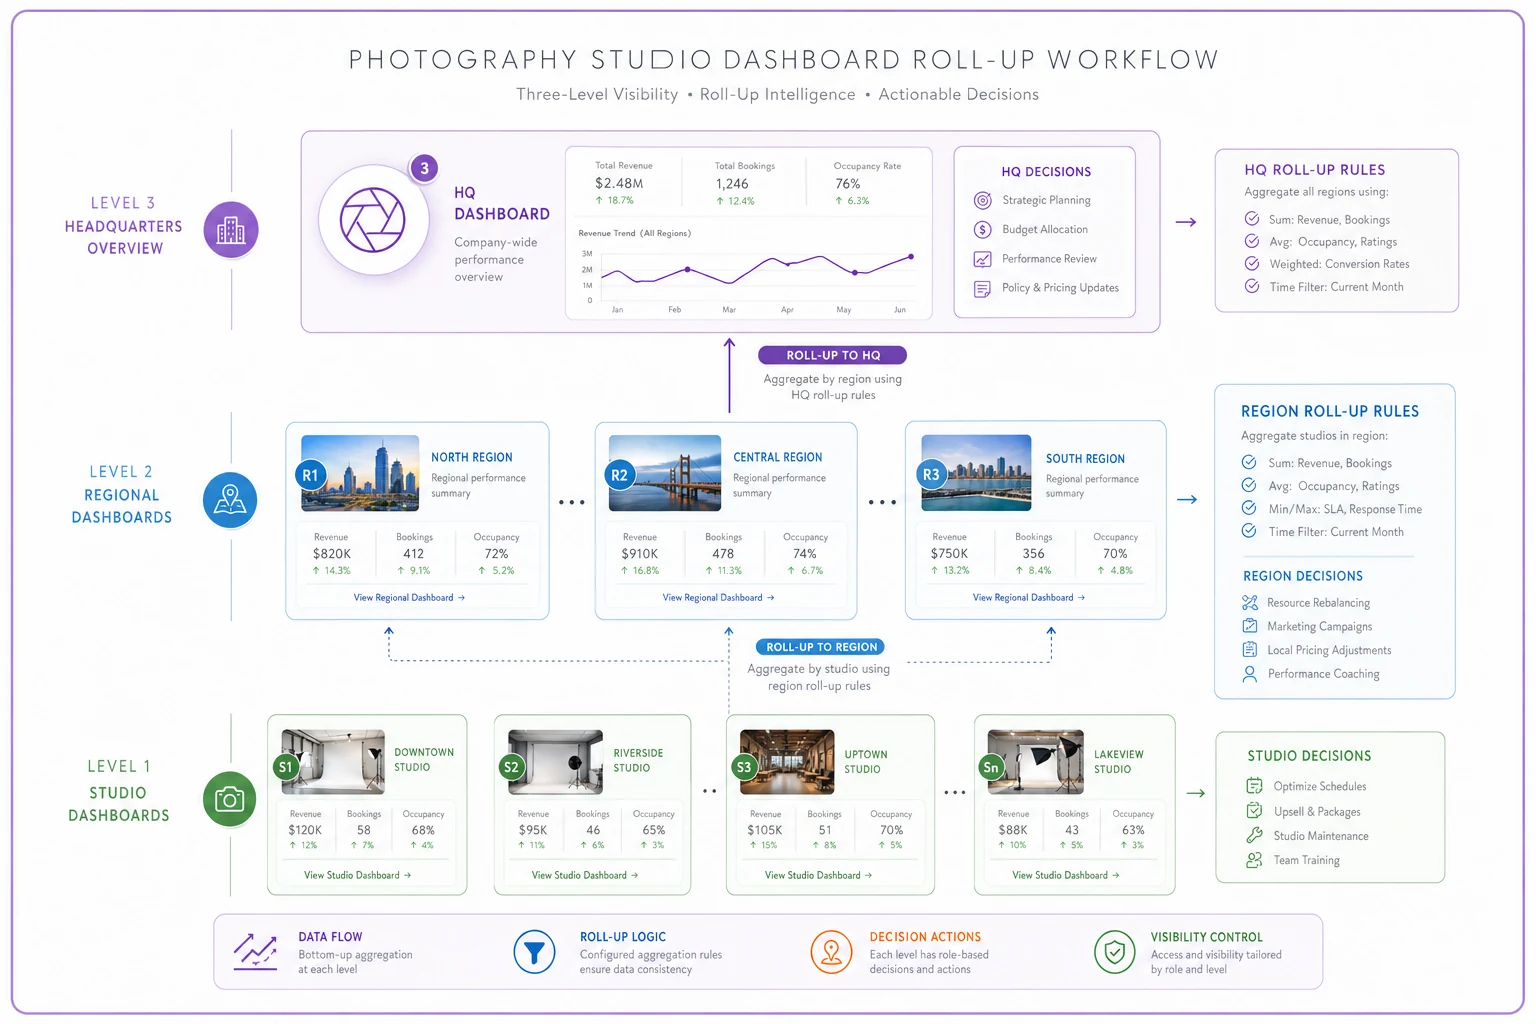
Keep the visual focused on decisions: which metrics are acted on at each level and how they roll up.
A reporting cadence that people actually follow
The best taxonomy in the world fails if the reporting rhythm is wrong. Report too often and people stop reading. Report too rarely and problems compound before anyone notices.
Match the cadence to the altitude:
-
Daily — operational metrics, but passive. The location manager glances at the dashboard; nothing is "submitted." Daily reporting that requires human effort dies within a month.
-
Weekly — a 20-minute location review. Fill rate, queue depth, no-shows. This is a conversation between the manager and their team, not a report sent upward.
-
Monthly — the tactical review at the regional level. This is where someone actually compares locations side by side and reallocates attention. Package mix drift, conversion softness, labor creep.
-
Quarterly — the strategic review. Profit per location, investment decisions, which site gets the next hire or the next gear budget.
The mistake almost everyone makes early is reversing this — doing heavy monthly reports on operational data and only quarterly check-ins on strategy. You end up with beautiful month-end decks about no-show rates (which needed action three weeks ago) and knee-jerk strategic decisions made with no real trend behind them.
Governance: who owns the number and who gets to change the definition
This is the part studios skip, and it's the part that determines whether any of the above survives past six months.
Every metric needs an owner — the single person accountable for the number being correct and current. Not the person who performs well on it. The person who guarantees its integrity. No-show rate is owned by the location manager. Contribution margin is owned by whoever runs finance, or the owner directly. When a number looks wrong, there's one phone call to make, not a group chat.
Record the owner and the data source in the same doc so the one-call accountability is obvious.
Every metric also needs a locked definition. This is what prevents the three-definitions-of-"booked" disaster. A booked session means deposit cleared. Full stop. Written down. The definition doesn't change because one location finds it inconvenient. If a definition genuinely needs updating, that's a deliberate decision at HQ with a changelog — so when a trend line shifts, you know whether the business changed or just the definition did.
-
- [ ] Every KPI has exactly one named owner
-
- [ ] Every KPI has a written definition with numerator and denominator spelled out
-
- [ ] Definitions are versioned — changes are dated and logged
-
- [ ] Each metric is assigned a single decision-altitude (operational / tactical / strategic)
-
- [ ] Roll-up method is documented per metric (sum / weighted / recompute)
-
- [ ] Targets are set per location, not copied across (a new location and a mature one shouldn't share a fill-rate target)
-
- [ ] One source of truth per number — if two systems report revenue, you've already lost
That last point matters more than it looks. The moment your booking system and your accounting export disagree on revenue, every meeting turns into a reconciliation argument instead of a decision. Centralizing where each number comes from — so booking data, deposit data, and delivery data all flow into one place rather than living in three disconnected tools — is what makes the whole taxonomy trustworthy. It's also the operational backbone behind not botching expansion in the first place, which is covered in the multi-location governance blueprint.
When operational software is set up well, this kind of data centralization happens automatically — your booking platform, payment processor, and delivery workflow all feed a single reporting layer, and the roll-up math runs without anyone manually pulling exports. The taxonomy still needs to be designed by a human. But the maintenance burden drops considerably when the data doesn't require stitching together by hand every month.
A worked example: reading three locations correctly
A studio group runs three locations. The owner opens the HQ dashboard and sees blended monthly revenue is healthy — roughly $140k–$150k across the group, up slightly from last quarter. On the old blended-average view, everything looks fine.
-
Location 1 (the original studio)
utilization around 78%, AOV near $820, contribution margin solidly positive. Mature and performing.
-
Location 2 (opened 14 months ago)
utilization climbing past 70%, but AOV sitting around $510 and labor running close to 41% of session revenue. It's busy but barely contributing.
-
Location 3 (newest, 7 months in)
utilization only around 45%, AOV healthy at $780. Not a sales problem — a demand-and-booking problem.
The blended average had hidden all three realities. The naive company AOV read as roughly $700; the volume-weighted real number was closer to $600 because Location 2's cheap, high-volume mix dragged it down.
The decisions that fell out of this were specific. Location 2 didn't need more marketing — it needed a package-mix and sales-process fix, because it was converting fine but converting cheap. Location 3 didn't need a sales fix — it needed lead-flow, because the sessions it did book were landing in good tiers. Two locations, two completely opposite interventions, and the only reason the owner could tell them apart was that the metrics were defined at the right altitude and rolled up correctly.
Within roughly a quarter, Location 2's labor-to-revenue ratio eased back toward the mid-30s as the tier mix shifted, and Location 3's utilization moved into the high 50s once lead flow improved. Not dramatic overnight numbers — just the steady, legible kind of improvement you get when you can finally see what's actually happening.
When this level of rigor makes sense — and when it doesn't
A full KPI taxonomy with roll-up rules and governance is overkill for a single studio. If you run one location, you don't need a three-altitude dashboard; you need a clean weekly glance at fill rate, turnaround, and AOV. Building elaborate governance around one site is just procrastination dressed up as planning.
This becomes worth the effort at the two-to-three location threshold, specifically the moment you can no longer personally see every location every week. That's the real trigger — not revenue, not headcount, but the point where you're making decisions about a location you didn't physically stand inside this week. When you're deciding based on a number instead of a feeling, the number has to be trustworthy.
Who should hold off: studios in the middle of an unstable expansion where the operating model itself is still changing week to week. If your package structure, pricing, and staffing model aren't stable yet, locking metric definitions is premature — you'll be rewriting them constantly. Stabilize the operation first, then instrument it.
One quiet warning: don't let the dashboard become the job. The point of all this is to spend less time staring at numbers and more time acting on the two or three that matter. If you've built something that takes two people a full day a month to maintain, you've built a reporting burden, not a decision tool. The right setup — one source of truth feeding clearly-defined, correctly-rolled-up metrics — should mostly run itself and surface the handful of things that actually need a human to decide.
Where this leaves you
The studios that scale cleanly aren't the ones with the most dashboards. They're the ones where everyone agrees what "booked" means, where percentages get recomputed instead of averaged, where each number has an owner and an altitude, and where the owner can look at three locations and immediately know which one needs leads, which one needs a sales fix, and which one just needs to be left alone to keep performing.
Your metrics system should get simpler to read as your business gets more complex to run. That's the whole test. If adding a fourth location makes your numbers harder to trust, the taxonomy isn't working yet. If it slots right in — same definitions, same roll-ups, same three altitudes — then you've built something that scales as fast as you can open doors.
Your metrics system should get simpler to read as your business gets more complex to run. That's the whole test. If adding a fourth location makes your numbers harder to trust, the taxonomy isn't working yet. If it slots right in — same definitions, same roll-ups, same three altitudes — then you've built something that scales as fast as you can open doors.
Ready to elevate your studio’s workflow?
Join 500+ studios using TryPixly to save time, reduce scheduling conflicts, and deliver exceptional client experiences.